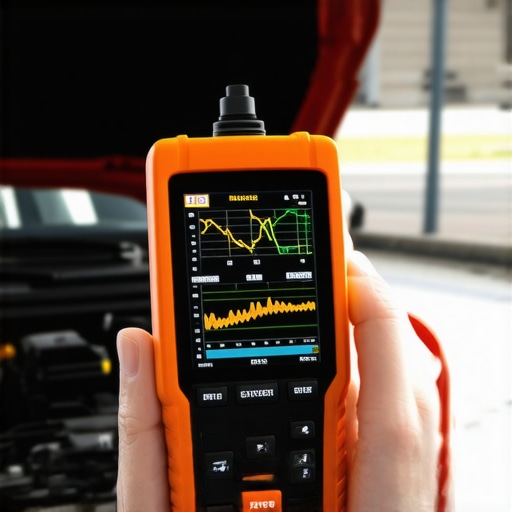
I’ve spent more nights than I care to admit standing in a cold driveway, staring at a flashing Check Engine light and feeling that soul-crushing rhythmic thud of a dead cylinder. There was one time, years ago, when I was certain my ignition coils had given up the ghost. I spent nearly $300 on a full set of replacements, only to find out it was a $15 vacuum leak hiding under the intake manifold. That’s the moment I realized that guessing is the most expensive way to fix a car. Today, I’m going to show you how to stop the guessing game by using live data to see exactly what your engine is feeling in real-time. Whether you’re dealing with a subtle stutter at idle or a violent shake under load, the data stream is your best friend.
The Secret Language of Your Car’s Computer
When you plug in a scanner, you aren’t just looking for codes; you’re looking for the story behind them. A simple P0300 code is like a doctor saying ‘you’re sick’ without telling you if it’s the flu or a broken leg. By diving into misfire counters and fuel trims, we can pinpoint the culprit before you even pop the hood. This level of insight is one of the top signs your car needs expert auto repair now if the data looks truly chaotic, but often, it’s something you can handle yourself. According to Delphi Technologies, even a single misfire can cause raw fuel to dump into your exhaust, potentially melting your catalytic converter in minutes. That is why staying on top of your regular tune-ups is so vital; it’s not just about performance, it’s about survival for your engine.
Is a high-end scan tool actually worth the hype?
You might think you need a five-thousand-dollar Snap-On tablet to see this stuff, but that’s a myth. Most modern Bluetooth dongles can read misfire counts per cylinder for less than the cost of a tank of gas. I used to be skeptical too, thinking these ‘cheap’ tools were just toys, but they’ve saved me from unnecessary transmission overhauls by proving the ‘shudder’ was actually an engine miss. Have you ever felt that sinking feeling when a new part doesn’t fix the problem? Tell me about your most frustrating ghost-in-the-machine moment.
Stop Guessing and Start Reading the Stream
The first step to a pro-level diagnosis is getting your car into ‘Closed Loop’ mode. This is the state where the engine’s computer stops following a rigid, pre-programmed recipe and starts listening to the oxygen sensors in the exhaust. If you try to diagnose a stumble or a hesitation while the engine is cold, you are chasing ghosts. During my essential car service tips for safe summer drives, I always tell people to let the car idle for at least ten minutes before looking at the scanner. Once that status on your screen flips from ‘Open’ to ‘Closed,’ the numbers you see are the literal truth of how the engine is breathing.
What Fuel Trim Percentages Are Screaming
Look for ‘Short Term Fuel Trim’ (STFT) and ‘Long Term Fuel Trim’ (LTFT). Think of these like the thermostat in your house. If you set it to 70 degrees but the heater has to run constantly to keep it there, you know you have a drafty window. In your engine, if the LTFT is showing a positive number higher than 10%, your car is adding extra gasoline to compensate for an air leak. This is the most common reason people fail their emissions tests or experience a sluggish response. By staying on top of a regular tune-up, you can usually catch these numbers creeping up before the Check Engine light even thinks about turning on. I once spent three days hunting a ‘bad injector’ on an old truck only to realize the LTFT was pegged at 25% because of a tiny crack in a vacuum line that cost two dollars to replace.
Hunt Down the Misfire Without Pulling Plugs
Most mid-range scanners have a ‘Misfire Monitor’ screen. This is where the magic happens. Instead of guessing which of the six or eight spark plugs is failing, you can watch the counter in real-time. If Cylinder 4 shows 152 misfires and the others show zero, you’ve found your target. I remember a specific case where a friend’s car felt like the transmission was neutralizing or slipping while cruising at 50 mph. He was ready to sell it for scrap. We plugged in the scanner, and instead of a transmission fault, we saw Cylinder 2 dropping fire every time the engine went under load. A simple ignition coil swap fixed the ‘transmission’ problem in five minutes. This is how to tell if a transmission shop is lying about a rebuild; if they haven’t checked for an engine misfire first, they are just looking for a payday.
Check Your Exhaust Health in Seconds
Finally, look at your downstream oxygen sensor voltage. It should be a steady, lazy line, unlike the upstream sensor which bounces like a heart monitor. If that downstream sensor starts mimicking the upstream one, it’s a clear sign that your internal catalyst is no longer doing its job. Learning how to tell if your catalytic converter is actually failing through data rather than just ‘smelling rotten eggs’ can save you from a massive repair bill. If the data is jumping all over the place, those are the top signs your car needs expert auto repair now because an exhaust restriction can eventually choke the engine until it won’t start at all.
Stop Blaming the Sensors for Doing Their Job
Most DIYers—and even some ‘pros’—fall into the trap of what I call the ‘Parts Cannon.’ They see a code for a lean condition and immediately buy a new oxygen sensor. In my experience, this is usually the exact opposite of what you should do. Sensors are just messengers; if an O2 sensor tells the computer the engine is lean, it is because it actually *is* lean. Replacing a perfectly good sensor just because it reported a problem is like firing a security guard for reporting a break-in. This is why many people find that why your tires still wear unevenly after a professional shop alignment—the focus was on the result, not the root cause. When you dive into the live data, look at the sensor’s response time rather than just the number. A ‘lazy’ sensor that reacts slowly is the real enemy, not one that is accurately reporting a vacuum leak.
Why does your scanner show different data than the dashboard?
This is where the real nuance begins. Your dashboard gauges are often ‘buffered’ to prevent drivers from panicking. Your coolant gauge might stay dead-center from 180°F to 220°F, but your scan tool will show the literal, fluctuating truth. If you see your scanner reporting 225°F while the needle hasn’t budged, you are looking at the early warning signs of a cooling system failure. This discrepancy is often the one electrical fault that most mechanics misdiagnose as a dead battery because they aren’t looking at the system’s actual load. According to the National Institute for Automotive Service Excellence (ASE), the misinterpretation of scan tool data accounts for a significant percentage of unnecessary part replacements in modern shops.
The One Wire That Makes Pro Mechanics Look Like Geniuses
If you’re seeing ‘impossible’ data—like a transmission temperature of -40°F in July or a misfire that jumps from cylinder to cylinder with no pattern—stop looking at the sensors and start looking at your grounds. A loose or corroded ground wire can cause the engine’s computer to see ‘noise’ instead of signals. This is the hidden ground strap that causes weird electrical ghosts that drive people to sell their cars in frustration. I’ve seen cases where a frayed wire made a owner think they needed a new gearbox, when in reality, the computer just couldn’t ‘hear’ the speed sensor over the electrical static. It’s also a common reason why your transmission slips when the engine is cold; the solenoid signals are getting lost in translation. Have you ever spent a fortune on parts only to realize it was a loose wire or a five-dollar gasket all along? Have you ever fallen into this trap? Let me know in the comments. By shifting your mindset from ‘fixing the code’ to ‘validating the data,’ you move from being a parts-changer to a diagnostic expert. Always remember: the scanner is a tool for your brain, not a replacement for it. If the data doesn’t make sense, go back to the physical basics of air, fuel, and spark.
The One Mode on Your Scanner You Are Probably Ignoring
To truly stop being a parts-changer, you need to dive into ‘Mode $06’ data. This is the raw, unedited basement of your car’s computer where it stores the results of self-tests that haven’t yet reached the threshold of a Check Engine light. I’ve found that checking these hex codes is the best way to catch a failing ignition coil weeks before it leaves you stranded on the shoulder. While most people wait for a light to tell them what to do, a pro looks at the ‘test limit’ versus the ‘actual value.’ If your limit is 100 and your engine is sitting at 98, you don’t have a code yet, but you definitely have a problem. This level of foresight is how you maximize your cars lifespan with regular tune-ups because you are fixing parts based on their actual performance, not just a calendar date. According to technical guides from the Professional Automotive Technicians Network (iATN), Mode $06 data is often the only way to verify a repair on complex evaporative emission systems without driving the car for three days.
How do I keep my car’s diagnostic health on track over the years?
Consistency is more important than expensive equipment. I recommend ‘baselining’ your vehicle. Once a year, when the car is running perfectly, plug in your scan tool and take a screenshot or log of your fuel trims, oxygen sensor voltages, and engine load at idle. This gives you a ‘map’ of a healthy engine. When things eventually go south, you aren’t just guessing what the numbers should be; you have the literal blueprint of your specific car’s health to compare against. This is especially helpful if you’re trying to how to spot a clogged catalytic converter in 2 minutes by comparing current backpressure data to your baseline.
Why a Cheap Infrared Thermometer is Your Secret Weapon
While the scan tool tells you what the computer thinks, an infrared thermometer tells you what is actually happening physically. I call it the 10 tool that saves your engine from overheating because it can find a clogged radiator or a stuck thermostat before the dash needle even moves. I personally use it to check the temperature of each exhaust manifold runner; a colder runner is a dead giveaway for a misfiring cylinder, even if the computer is being vague. It is also the fastest way to how to find a parasitic battery drain with a simple multimeter by looking for ‘hot’ fuses in a car that has been sitting overnight.
Where the Future of Home Repair is Heading
We are moving into an era of ‘Predictive Telemetry.’ Soon, your car won’t just tell you something is broken; it will use machine learning to tell you that based on your driving habits, your water pump has a 90% chance of failing in the next 500 miles. Until that software is standard, you are the processor. By staying ahead of the curve and investing in how transmission overhauls save you money in the long run through preventative fluid swaps and data monitoring, you can easily push a modern vehicle past the 300,000-mile mark. If you’re currently dealing with a weird symptom, don’t just clear the code. Go out to your driveway right now, plug in your scanner, and look at your Short Term Fuel Trim while you spray a little brake cleaner around the intake manifold. If those numbers jump, you’ve found your leak without spending a dime on parts.
Hard Truths From the Bottom of My Toolbox
After decades of twisting wrenches, I’ve learned that the most expensive part you’ll ever buy is the one you didn’t actually need. The biggest mistake most of us make is treating a trouble code like a shopping list. A code for a lean condition doesn’t mean you need an O2 sensor; it means the sensor is doing its job and telling you there is too much air. I’ve seen countless DIYers replace perfectly good alternators and batteries when the real culprit was the hidden ground strap that causes weird electrical ghosts. The data stream is there to prevent that frustration. It’s also important to remember that ‘intermittent’ problems are rarely the sensor itself but usually a loose connection or a chafed wire. If a number looks physically impossible—like your engine temperature jumping from 150 to 220 degrees in one second—stop looking at the cooling system and start looking for the one electrical fault that most mechanics misdiagnose as a dead battery. These moments of clarity only come when you stop reacting and start observing.
Gear That Saves Your Weekend and Your Wallet
You don’t need a professional shop to have a professional-grade diagnostic kit. To keep your car healthy, I recommend three specific things that have never let me down. First, a reliable Bluetooth OBD-II adapter that supports live graphing—seeing the data as a wave instead of just numbers makes a world of difference. Second, I always keep an infrared temp gun nearby; it’s the 10 tool that saves your engine from overheating by verifying if your radiator is actually flowing. Finally, never underestimate the power of a digital multimeter. Learning how to find a parasitic battery drain with a simple multimeter will save you from waking up to a dead car on Monday morning. These tools, combined with the data on your screen, give you a complete picture of your vehicle’s health that no dashboard light can match.
Become the Master of Your Machine
There is a unique sense of pride that comes from fixing a complex issue with your own two hands, especially when you know exactly why the fix worked. Modern cars are incredibly complex, but they are also more communicative than ever if you know how to listen. By committing to maximize your cars lifespan with regular tune-ups and monitoring the data before things break, you aren’t just saving money—you’re building a relationship with your machine. If the numbers ever look truly overwhelming, don’t be afraid to consult a professional, as knowing the top signs your car needs expert auto repair now is just as important as knowing how to use a scanner. Go out there, plug in, and start learning. What is the most confusing data point you’ve ever seen on your scanner? Let’s figure it out together in the comments below.